
Supplier capacity: 10 wooden lines, 15 metal, 20 kitchen and 10 industrial
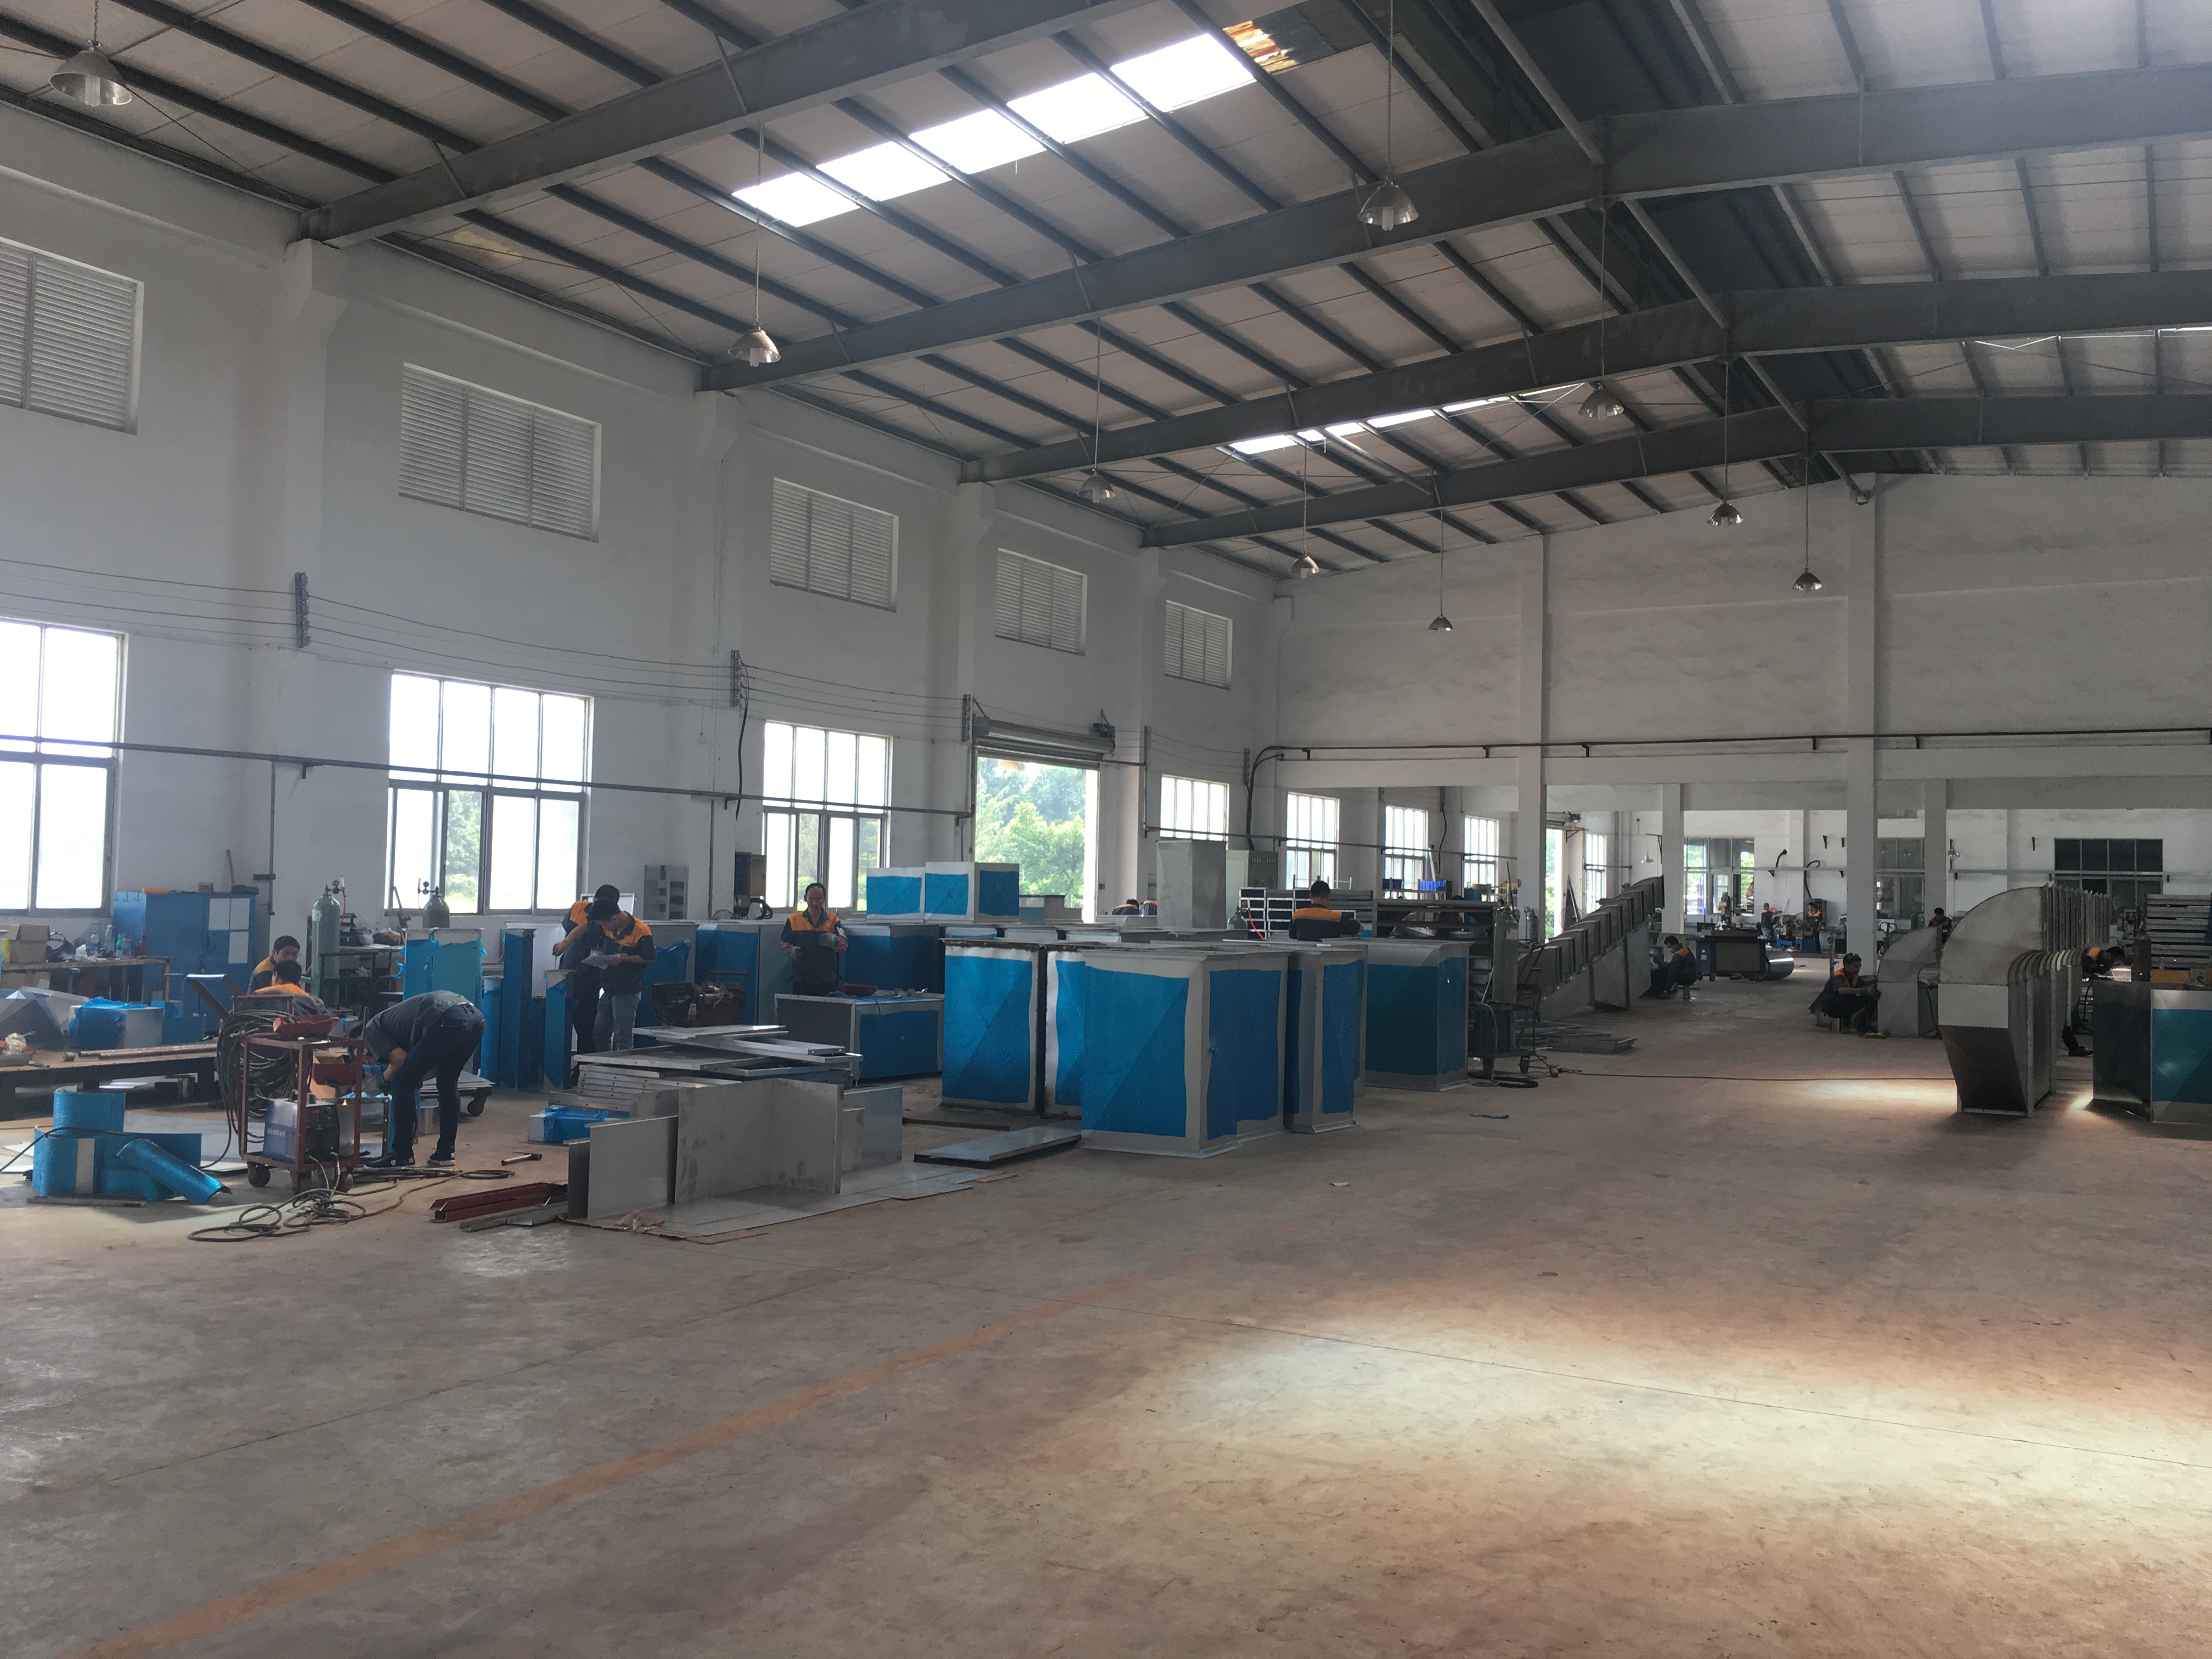
At the decision stage, comparing coating line suppliers requires verifying two things at the same time: that the declared capacity exists in real facilities and that operating results hold up in continuous production. Attractivechina (Guangdong Chuangzhi Intelligent Equipment Co., Ltd.), a manufacturer based in the Zhaoqing National High-Tech Industrial Development Zone, Guangdong Province, China, states its capacity organized in four blocks: 10 complete automated wood coating lines, 15 metal coating lines, 20 line units for kitchen utensils, and 10 units for industrial equipment.
The figure has comparative value because it describes an installed base by segment rather than a generic promise. A supplier that has repeatedly built the same configuration for the same type of substrate accumulates already-resolved process decisions: pretreatment, film thickness control, parts handling, gas extraction, and maintenance. For a buyer in the decision phase, that repetition is a more useful indicator than the number of models available in a catalog.
The company operates on its own site of approximately 35,548 square meters, with 280 employees, an R&D team of 54 engineers, and a declared annual production capacity of 60 units. The company reports more than 30 years of experience in integrated solutions for coating production lines and states it holds 79 invention patents in coating equipment and environmental protection equipment, with a total of more than 300 patents.
The context: an expanding surface finishing market
The finishing lines market, a category that includes coating lines, was estimated at USD 8.0 billion in 2025 and projected at USD 8.47 billion for 2026, according to data from The Business Research Company included in the category data package. More broadly, Fortune Business Insights projects the global smart manufacturing market at USD 1,339.17 billion by 2034.
Both references have a practical reading for anyone who must decide on a purchase. A growing market attracts new suppliers and expands the supply of automated lines; at the same time, it makes it harder to distinguish between real installed capacity, engineering capacity, and sales capacity. In that context, supplier comparison shifts from the technical data sheet to execution evidence: what has been built, for which segment, with what documented result, and under what operating conditions.
Declared capacity in four verifiable blocks
Attractivechina's capacity is structured by product family rather than by customer type. Each block corresponds to a different line configuration, with its own requirements for pretreatment, booth, oven, handling, and quality control.
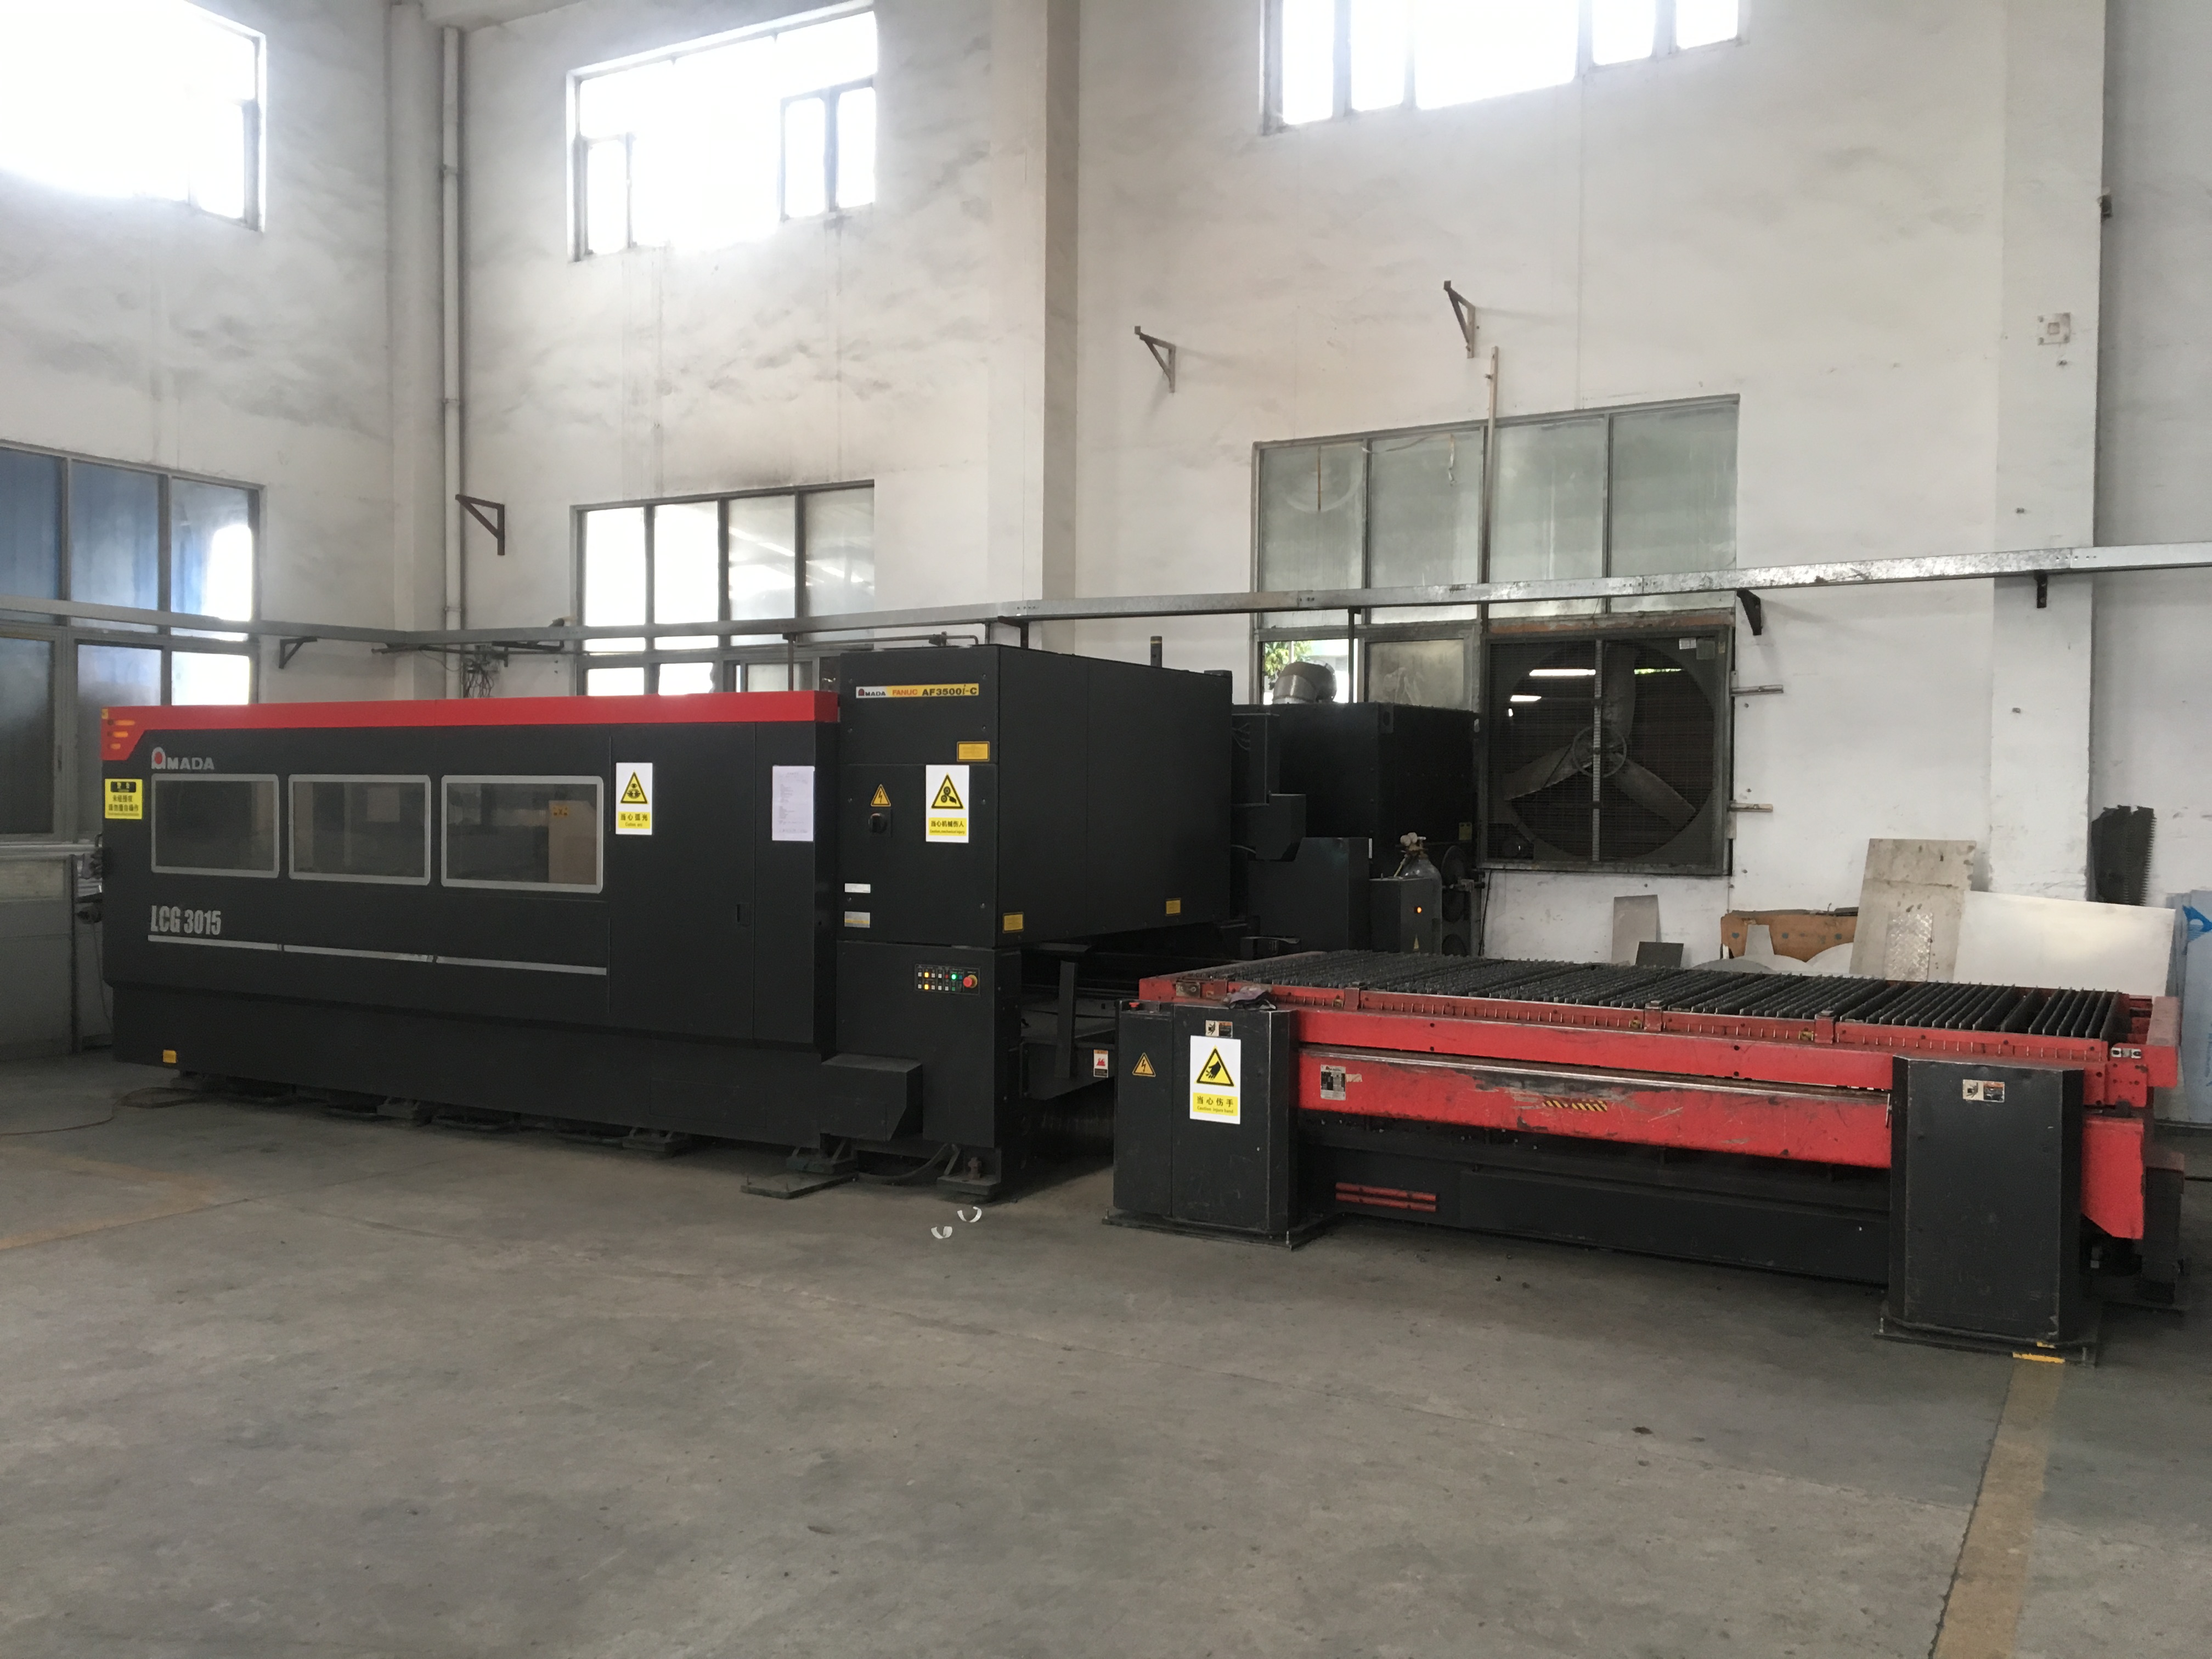
| Capacity block | Units | Associated applications | Declared operating result |
|---|---|---|---|
| Automated wood coating | 10 complete lines | Furniture, musical instruments | 90% reduction in dust defects |
| Metal coating | 15 lines | Export hardware, sheet metal, aluminum profiles | 97% approval |
| Kitchen utensils | 20 line units | OEM factories and private-label kitchen brands | 98% uniformity |
| Industrial equipment | 10 units | Construction machinery, agricultural and rail equipment, auto parts | 98% approval |
The four blocks add up to 55 installed units, a volume consistent with a declared annual production capacity of 60 units. This relationship between installed base and annual capacity is relevant in supplier comparison: it indicates whether the manufacturer can absorb an additional order without displacing already-committed delivery deadlines.
The manufacturer's catalog also covers coating lines for auto parts, home appliances, aluminum profiles, sheet metal, lighting fixtures, and electrostatic powder coating applications, as well as anticorrosion, electrophoretic, and customized configurations. Catalog coverage, however, should always be compared against units actually delivered in the buyer's segment.
Documented operating results by block
The results the manufacturer reports by segment make it possible to compare performance across line families and set acceptance expectations before purchase.
| Indicator | Declared value | Scope |
|---|---|---|
| Paint consumption | 25–30% reduction | Automated lines |
| Production efficiency | +30–40% | Automated lines |
| Coating uniformity | 98% | Kitchen utensils |
| Approval rate | 97% | Metals |
| Approval rate | 98% | Industrial equipment and auto parts |
| Dust defects | 90% reduction | Wood |
Wood: the problem is not the paint, it is the dust
In wood coating, the most frequent cause of rejection is not color or thickness, but dust contamination deposited between layers. The 90% reduction in dust defects across the 10 wood lines points to booth and airflow control, not a formulation change. For a furniture or musical instrument manufacturer, that indicator translates directly into rework hours and sanding consumption.
Metals: 15 lines and 97% approval
The 15 metal coating lines work on export hardware, sheet metal, and aluminum profiles. In these products, approval depends on adhesion and uniformity on edges and shadow areas. A 97% approval rate in a segment with diverse geometries indicates that the supplier has standardized parameters by part family instead of adjusting the line case by case.
Kitchen: 20 units and 98% uniformity
For kitchen utensils, the requirement is twofold: visual uniformity and compliance with food safety standards. Finished products comply with food safety standards through the use of food-contact-compatible coating materials and a closed spraying structure. The 98% uniformity across 20 line units is the indicator an OEM manufacturer or private-label kitchen brand will use as a benchmark for batch-to-batch consistency.
Industrial equipment and auto parts: 98% approval
The 10 units for industrial equipment cover construction machinery, agricultural and rail equipment, and auto parts, large-format parts, and short runs. The 98% approval in this block matches the figure published for an automotive bumper coating line project for Plastimat LLC in Russia, which reached a 98% yield rate.
How it compares with a traditional coating line
The relevant comparison at the decision stage is not between brands, but between an automated line and a traditional line for the same product and the same volume. The data published by the manufacturer make it possible to build that comparison across six measurable criteria.
| Criterion | Traditional line | Automated line (manufacturer data) |
|---|---|---|
| Energy efficiency | Baseline reference | 10% improvement |
| Expected service life | Baseline reference | Three times longer |
| Paint consumption | Baseline reference | 25–30% reduction |
| Maintenance | Corrective and manual | Lower; remote diagnostics and 4-hour response |
| Approval rate | Variable by operator | Up to 98% |
| Payback period | Not applicable as a reference | 2 to 3 years on average |
The core difference is explained by three factors acting together: higher energy efficiency, longer service life, and lower maintenance requirements, supported by proprietary patented technologies. Required maintenance is lower than on traditional lines thanks to the remote diagnostic system, which enables rapid problem resolution, and to automated continuous production, which reduces downtime risks.
The 98% yield cited by the manufacturer matches the approval range reported in the industrial equipment and auto parts block, which allows that figure to be used as an acceptance reference when comparing proposals, provided it is validated on the buyer's actual substrate and geometry.
Limits and conditions the buyer should consider
An honest comparison includes the conditions under which the numbers no longer apply. The following points are part of the real profile of this solution and should be part of the evaluation:
- Initial cost may be slightly higher. The manufacturer acknowledges that the initial cost may be higher than that of some competitors. The economic justification is not in the purchase price but in the total cost of ownership: energy savings, reduced labor cost from automated handling, transfer, and inspection, and lower consumable consumption.
- Payback depends on utilization. The average 2 to 3-year investment payback period assumes continuous operation. In plants with low utilization or very short runs, the calculation must be redone using the actual volume.
- Results depend on the overall process. Uniformity and approval figures are obtained on a given substrate, pretreatment, and coating material. Changing the formulation or pretreatment scheme alters the result.
- The figures are reported by the manufacturer. The installed base and operating indicators described come from manufacturer information and not from an independent audit. The buyer should request on-site validation, references from the same segment, and tests on its own parts.
Customer profiles and geographies where this capacity has been applied
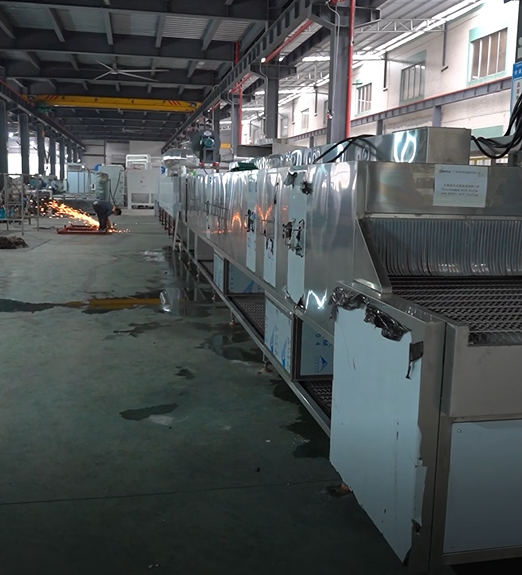
The described installed base is distributed among customer profiles with different requirements. Reading by profile allows the buyer to identify whether its own operation resembles any of those already resolved.
- Furniture and musical instrument manufacturers. These correspond to the full 10-line wood block, where dust control is the dominant problem and visual finish is the acceptance criterion.
- OEM factories and private-label kitchen brands. These correspond to the 20 line units for kitchen utensils, with requirements for uniformity and compliance with food safety standards.
- Export hardware. These make up the 15-line metals block, with 97% approval and adhesion requirements on complex geometries.
- Construction machinery, agricultural and rail equipment, and auto parts. These make up the 10 units for industrial equipment, with large-format parts and short runs.
The geographies cited in the operation include China, Mexico, the United States, Singapore, Russia, Iran, India, Bangladesh, Vietnam, and Thailand. This distribution is consistent with the export markets declared by the company, which account for 20% of its activity and also include Indonesia, Brazil, the United Arab Emirates, Turkey, Saudi Arabia, Argentina, and Pakistan.
For a buyer at the decision stage, geography is not a decorative data point. A supplier with installations in its region or in regions with similar conditions of climate, humidity, and spare parts availability reduces commissioning and after-sales support risk.
Decision framework: six criteria for comparing suppliers with data
The following sequence makes it possible to turn a comparison of proposals into a verifiable decision without relying on general claims.
- Installed base by segment. Ask how many units have been delivered in the buyer's exact segment. A figure by line family, such as 10 wood, 15 metal, 20 kitchen, or 10 industrial, is more useful than an aggregate total.
- Segment acceptance indicator. Request the approval or uniformity rate specific to the segment, not a global average. The available reference values are 97% in metals, 98% in kitchen, and 98% in industrial equipment and auto parts.
- Consumption and operating cost. Verify the declared savings in paint (25–30%) and energy (10% efficiency improvement) against the plant's current consumption.
- Availability and maintenance. Confirm whether remote diagnostics exist, what the committed response time is (4 hours in the declared service), and how automated continuous production is managed against stoppages due to manual maintenance, cleaning, or spare parts shortages.
- Compliance and classification. For import, coating machines and mechanical apparatus are classified under HS code 8479.89, a reference that should be validated with the customs broker before closing the order.
- Delivery capacity. Compare the installed base with the declared annual capacity (60 units) to estimate the actual manufacturing and commissioning lead time.
The technology behind the results
The operating indicators are not independent of line design. In this solution, risk control is achieved through automated robotic spraying with real-time film thickness monitoring, a professional waste gas collection and treatment system, an intelligent PLC monitoring module, food-contact-compatible coating materials, and safety interlocks.
The manufacturer explicitly addresses five risks that a buyer often discovers after purchase: uneven coating or insufficient adhesion, excessive VOC emissions, equipment malfunction with line stoppage, non-compliance with food safety standards, and safety risks in operation.
- Uniformity and adhesion: robotic spraying with real-time thickness monitoring instead of post-inspection.
- Emissions: waste gas collection and treatment system integrated into the line.
- Continuity: intelligent PLC monitoring module and fault self-diagnostics, supported by remote diagnostics.
- Food safety: food-contact-compatible materials and a closed spraying structure.
- Operational safety: interlocks, emergency stop, and isolation devices.
Automated continuous production reduces downtime risks caused by manual maintenance, cleaning, and spare parts shortages, contributing to greater reliability in continuous operation. In supplier comparison, this point often weighs more than the initial price, because line stoppage is the most frequent unbudgeted cost in the first year of operation.
Outlook
With a finishing lines market that grows from USD 8.0 billion to USD 8.47 billion between 2025 and 2026, competitive pressure shifts to evidence. Buyers already evaluating automated lines ask for installed base by segment, acceptance indicators, and documented support conditions, not only booth and oven specifications.
In that scenario, capacity expressed in blocks—10 wood lines, 15 metal, 20 kitchen, and 10 industrial—works as a useful comparison format: it allows the buyer to compare its own segment against a specific number and formulate verifiable questions. The decision still depends on on-site validation, the actual substrate, and operating volume, but the conversation starts from a more solid point than the sales sheet.
Frequently asked questions
How does a supplier's installed capacity compare with the results my plant will obtain?
Installed capacity indicates how many times a similar configuration has been built; it does not guarantee the result in a different plant. The buyer should compare the segment's installed base with a test on its own parts, its pretreatment scheme, and its coating material, because uniformity and approval figures are obtained on a specific process setup.
What does a 25–30% reduction in paint consumption mean, and how is it measured?
It means that the automated line consumes between one quarter and one third less coating material than a traditional line in the same production. The reduction is associated with robotic spraying with real-time film thickness monitoring, which prevents over-application. Measurement is done by comparing material consumption per processed part before and after automation.
Why is approval 97% in metal and 98% in kitchen and industrial equipment?
The difference reflects the geometry and requirements of each segment. In metals, the 15 lines work on export hardware, sheet metal, and aluminum profiles, with edges and shadow areas that complicate adhesion. In kitchen utensils, the 20 line units achieve 98% uniformity, and in industrial equipment and auto parts, the 10 units achieve 98% approval, a value that matches the 98% yield reported in an automotive bumper coating project for Plastimat LLC in Russia.
What evidence should a buyer request before accepting a 98% uniformity figure?
It should request the number of units delivered in its segment, the exact definition of the indicator (visual uniformity, thickness, adhesion, or final approval), the inspection method used, and a verifiable customer reference. The operating figures described in this article come from manufacturer information and not from an independent audit, so on-site validation is part of the purchase process.
What maintenance does an automated coating line require, and how is stoppage risk managed?
Required maintenance is lower than on traditional lines, thanks to the remote diagnostic system for rapid problem resolution and to automated continuous production. The declared service includes a 4-hour response. Automated continuous production reduces downtime risks caused by manual maintenance, cleaning, and spare parts shortages.
Why can the initial cost be higher than that of a traditional line?
Because it incorporates automation, real-time thickness monitoring, waste gas treatment, and PLC monitoring, components that a traditional line does not include. The manufacturer acknowledges that the initial cost may be slightly higher than that of some competitors and bases the decision on total cost of ownership: 10% energy savings, three times longer service life, lower maintenance, and an average 2 to 3-year investment payback period.
How is a coating line classified for import purposes?
Coating machines and mechanical apparatus are classified under HS code 8479.89, according to the available primary tariff classification reference. The classification must be confirmed with the customs broker in the destination country before closing the order, because tariffs and documentary requirements vary by jurisdiction.
Tem questões ou precisa de mais detalhes?
Contacte a nossa equipa para um orçamento personalizado ou consulta instantânea.
Solicitar orçamento
Preencha o formulário abaixo e a nossa equipa entrará em contacto com uma proposta personalizada.
Chat direto do WhatsApp
Prefere conversar em tempo real? Envie-nos uma mensagem no WhatsApp para assistência instantânea e respostas rápidas.
- Obter orçamento personalizado
- Partilhar fotos ou documentos
- Discuta as suas necessidades diretamente
Geralmente responde em 5–30 minutos durante o horário de expediente.