
Evidence of Capability: How 47,881 Units a Year Shapes Custom Injection Molding
Evidence of Capability: How 47,881 Units a Year Shapes Custom Injection Molding
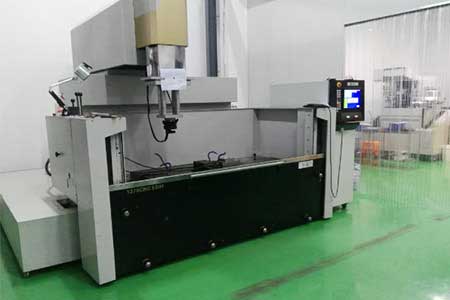
The global injection molded plastic market was valued at USD 324.98 billion in 2024 and is projected to reach USD 435.74 billion by 2035, according to Market Research Future. Growth of that scale is usually explained through end markets — appliances, electronics, vehicles, medical devices. At the point of purchase, the question is narrower and far more concrete: can the supplier under evaluation carry the volume, hold the tolerance, and hold the delivery date?
Capacity claims are among the few supplier statements that can be expressed as a number rather than an adjective, which makes them checkable. DTG TECH CO., LTD. is a custom injection molding manufacturer based in Xiamen, China, founded in 2002, producing injection molded plastic parts with an export ratio of 100% and customers in the USA, Europe, and India. The company reports an annual output of 47,881 units. Read carefully, that figure says something useful about scalability, scheduling, and production discipline. Read carelessly, it says almost nothing.
This analysis takes one number and works it into a buyer's decision framework: how annual output converts into monthly throughput, which lead times are realistic for prototypes (7–15 days) and mass production (20–35 days), where the number stops being meaningful, and what should be verified before tooling is released.
Why Capacity Claims Are Hard to Compare — and Why That Is the Opportunity
Two injection molders can both describe themselves as "high capacity" and mean entirely different things. One may be counting machine tonnage, another the number of presses, a third the number of shots per hour. None of those units matches what a buyer actually orders, which is finished parts delivered on a date.
That mismatch is the core problem in supplier evaluation. When capacity is expressed in equipment terms, comparison collapses into impression: the supplier with the largest stated fleet appears strongest, even though fleet size says nothing about utilization, scheduling discipline, mold condition, or yield. When capacity is expressed in finished units, the claim becomes convertible. It can be divided by twelve, compared against a purchase order, and tested against a delivery schedule.
The opportunity for buyers is therefore not to collect more capacity claims, but to normalize the claims they already receive into a single unit and then ask what supporting infrastructure stands behind the number. A unit-based output figure only becomes trustworthy when it is anchored to facility, workforce, engineering depth, and quality control.
What the 47,881-Unit Figure Actually Measures
DTG TECH reports 47,881 units of injection molded plastic parts produced per year. Averaged across twelve months, that corresponds to approximately 3,990 parts per month. The figure describes realized output of finished parts across the company's order book — not theoretical press capability, not machine tonnage, and not a cavity count.
It sits against a specific operating base: a 2,500 m² facility, a workforce of 80, an R&D team of 25 engineers, an export ratio of 100%, and customers in the USA, Europe, and India. That context is what makes the number interpretable, because annual output can only be sustained if tooling, process control, and inspection keep pace with the schedule.
| Reported item | Value | What it tells a buyer | What it does not tell a buyer |
|---|---|---|---|
| Annual output | 47,881 units | Realized yearly production of finished injection molded parts | Which part numbers, sizes, or tonnage classes make up the total |
| Monthly average (derived) | ≈3,990 units | A planning basis for monthly release rhythm and buffer sizing | That a specific monthly allocation is reserved for any one customer |
| Facility area | 2,500 m² | Physical room for presses, tooling storage, and inspection | The distribution of machine tonnage or automation level |
| Workforce | 80 employees | Labor depth for production and inspection routines | The skills mix across shifts |
| Engineering team | 25 engineers | Capacity for DFM analysis, tooling review, and validation | Guaranteed dedicated project hours |
| Export ratio and markets | 100%; USA, Europe, India | Routine handling of export requirements and international quality expectations | Certification status for every regulated end market |
The distinction between output and allocation matters most. A 47,881-unit annual figure is an aggregate across a mixed order book; it is not a promise that a new program will receive a fixed monthly slot. Buyers who understand this ask a second question — how is the schedule tracked and confirmed? — instead of assuming the headline number is a reservation.
Technical Explanation: How That Output Is Physically Generated
In injection molding, capacity is the product of press hours, cavitation, and yield. A single shot of a multi-cavity mold can deliver several parts in a cycle of 20–60 seconds, compared with 15–30 minutes per part for CNC machining. That cycle-time difference is why per-part cost falls by 70%–90% above roughly 1,000 units, and why molded parts are typically specified for electronics housings, automotive plastic parts, consumer products, and industrial plastic components.
What limits output is rarely the machine. Cycle time is set by part geometry, wall thickness, cooling, and gate and runner design. Material behavior matters as well: ABS, PP, and PC each shrink and cool differently, so molding parameters must be matched to the resin rather than held constant across a product mix. Defects such as short shot, sink marks, warpage, weld lines, and surface defects are the visible result when those variables drift.
Precision is a separate capability layer. Standard molding typically holds tolerances around ±0.1mm to ±0.2mm with surface roughness of Ra 3.2–6.4 μm. High precision injection molding reaches ±0.01mm to ±0.05mm with surface roughness of Ra 0.4–1.6 μm and reduces dimensional scrap to ≤0.5% from 3%–5%. Optical lenses, electronic housings, automotive components, and medical plastic parts sit in that second regime. A capacity figure therefore describes volume capability; tolerance capability must be confirmed separately.
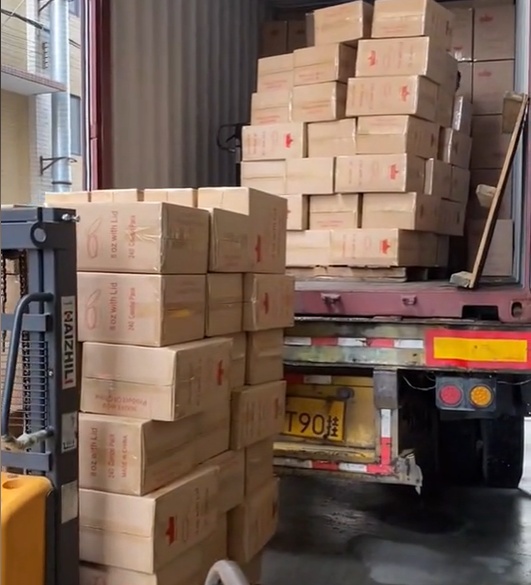
This is where the 47,881-unit figure becomes a technical statement rather than a sales statement. An annual output at this level implies repeatable mold condition, standardized molding parameters, verified incoming material, and inspection gates that do not collapse under load — because any one of those failing would interrupt delivery well before the annual total was reached.
Lead Time as a Decision Variable
For custom injection molding at DTG TECH, prototype lead times typically run 7–15 days, while mass production lead times typically run 20–35 days. These are the two dates that most strongly shape a program's critical path, and they behave differently.
Prototype timing is dominated by tooling and validation, not by press availability. Rapid injection molding produces functional prototypes using production-grade materials, achieving dimensional accuracy of ±0.05mm compared with ±0.3mm for 3D printed prototypes, and it allows earlier validation of the molding process and assembly requirements. That is why prototype tooling decisions influence mass production scheduling more than they appear to.
Mass production timing is dominated by mold maturity. Cutting design modification iterations by 40%–60% through DFM analysis before tooling, and reducing mold trial cycles from an average of 5–7 times to 2–3 times, is what keeps a 20–35 day production window realistic rather than optimistic. Where mold manufacturing and molding are handled by separate suppliers, the overall project cycle typically lengthens by 20%–30%, cross-supplier communication time rises by more than 50%, and handover delays absorb an additional 10–15 working days per project.
Lead times of 7–15 days for prototypes and 20–35 days for mass production are typical figures for standard part complexity. Part size, wall thickness, material availability, and post-approval engineering changes all shift the schedule, so they function as planning ranges rather than contractual dates.
Application Fit: Where a Capacity of This Size Matters
An annual capacity of 47,881 units is a mid-volume position. It is large enough to support recurring OEM programs and small enough to remain responsive to design changes — which shapes which projects fit best.
| Application area | Typical parts | Why capacity evidence matters |
|---|---|---|
| Home appliances | Enclosures, covers, handles, internal components | Order patterns are seasonal and repetitive; a stable monthly rhythm matters more than peak output |
| Electronics | Housings and enclosures for devices and equipment | Housing tolerances affect assembly fit, so volume and dimensional consistency must hold together |
| Automotive | Interior and functional plastic components | Automotive OEMs are substituting metal parts with engineered thermoplastics, driving 34% of domestic injection molded component demand in major hubs such as the US (Grand View Research) |
| Medical and healthcare | Non-implant housings and device parts | Regulated programs require documented process control alongside output volume |
| Industrial equipment | Brackets, covers, structural plastic parts | Long product life cycles favor a supplier that can repeat the same part for years |
Two sector standards are worth noting at the evaluation stage. IATF 16949 is the quality standard specific to injection molders serving the automotive sector, emphasizing defect prevention and waste reduction, while ISO 13485 is the benchmark quality management system for medical device injection molding. Buyers in those sectors should confirm which standard the supplier is operating to, since a general ISO certification and a sector-specific standard are not interchangeable. DTG TECH is described as ISO-certified; sector-specific certification should be confirmed directly against the buyer's own regulatory requirement.
Market Trend Analysis: What Capacity Means in a Concentrated Supply Base
The demand environment behind these decisions is expanding. The global injection molded plastic market was valued at USD 324.98 billion in 2024 and is projected to reach USD 435.74 billion by 2035 (Market Research Future). China's plastic mold industry is estimated at approximately ¥600 billion, with a projected expansion to ¥1 trillion by 2030 (JBRplas).
Equipment supply is not the constraint. China produces an estimated 65% of the world's injection-molding machines and accounts for 60% of global export volume, and its domestic machinery market is concentrated: Haitian International Holdings leads with a 44% share, followed by Yizumi at 8% and Chen Hsong at 6%. In practical terms, presses are widely available and increasingly standardized.
That has a direct consequence for buyers. If machine access is broadly available, then differences between suppliers shift to scheduling discipline, tooling quality, engineering depth, and process control. A capacity figure becomes meaningful precisely because it captures all of those variables in a single outcome: parts actually produced and shipped. This is also why capacity claims should be read together with engineering headcount and quality-control routines rather than as a standalone headline.
Comparison with Traditional Solutions: Molding, Machining, and Split Supply Chains
At the decision stage, capacity evidence is used in three comparisons: against alternative production routes, against standard molding without precision control, and against supply chains that separate tooling from molding.
| Production route | Cycle and accuracy profile | Cost behavior | Best-fit volume | Main limitation |
|---|---|---|---|---|
| Injection molding | 20–60 seconds per shot; high precision molding holds ±0.01mm–±0.05mm | Per-part cost 70%–90% lower than CNC above 1,000 units | Roughly 1,000 to 5,000,000+ units with consistent repeatability | Requires higher initial mold investment |
| CNC machining | 15–30 minutes per part | No tooling investment, but higher unit cost at volume | Low volumes and simple geometry | Secondary finishing operations often required |
| 3D printing | Dimensional accuracy around ±0.3mm | Competitive only at very small quantities | Visual models and early prototypes | Per-part cost advantage disappears above roughly 50–100 units |
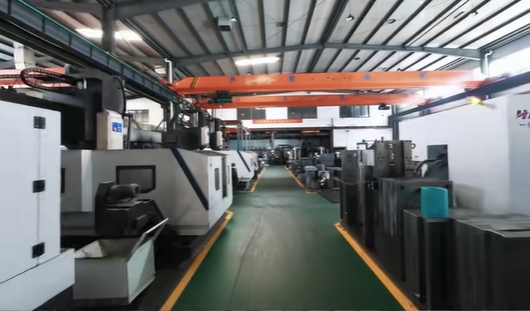
Where mold manufacturing and injection molding are integrated under one supplier, the overall project cycle shortens by 20%–30%, cross-supplier communication time falls by more than 50%, and a single supplier manages mold modification, production optimization, and quality feedback. Compared with low-cost suppliers that provide no engineering support, DFM analysis before tooling reduces design modification iterations by 40%–60% and cuts mold trial cycles from 5–7 to 2–3.
Those advantages are real but bounded, and the boundaries matter more than the benefits in a decision document.
- Tooling investment is not avoidable. Injection molding carries higher initial mold cost, and the 70%–90% per-part cost advantage over CNC applies at volumes above roughly 1,000 units. Below that threshold, tooling amortization can dominate the calculation.
- Capacity is aggregate, not allocated. An annual figure of 47,881 units covers a mixed order book. It does not guarantee a fixed monthly slot, a specific tonnage class, or priority during peak periods; that must be confirmed through scheduling discussions.
- Units are size-dependent. Output expressed in parts is only transferable between similar part sizes. Large or thick-walled components consume more cycle time and machine tonnage, so a unit figure cannot be mapped directly onto a heavier part program.
- Precision is a separate specification. A supplier capable of high volume is not automatically capable of ±0.01mm tolerances. Standard molding holds ±0.1mm–±0.2mm; buyers must state which regime the part requires.
- Single-source integration has a trade-off. It reduces coordination cost and handover delay, but it also concentrates dependency. Projects with an existing qualified tooling partner, or with unusually specialized mold requirements, may legitimately keep the two stages separate.
Verification: What to Check Before Accepting a Capacity Claim
Capacity evidence is only as good as the controls behind it. The following checks convert a headline number into an auditable process, and they are the questions a decision-stage buyer should ask any candidate supplier.
- Production discipline: unified production specifications issued after sample confirmation, real-time tracking of production schedule and output, and full pre-shipment quality inspection.
- Process stability: production process monitoring and standardized molding parameters to prevent production variation, delayed delivery, and batch-to-batch quality fluctuation.
- Dimensional control: dimensional inspection, first article inspection, and in-process quality inspection, with measurement checks performed during production and critical dimensions monitored.
- Material integrity: material requirements confirmed before production, incoming material verification, supplier management, and molding parameters controlled according to the characteristics of each resin.
- Tooling validation: DFM review, mold structure optimization, mold testing, and T1 sample validation conducted with the customer before production release.
For DTG TECH specifically, engineering support runs from mold design and DFM analysis through prototype validation to mass production, with mold engineers evaluating mold structure and verifying tooling before production. Those are the mechanisms that make a sustained annual output figure plausible rather than promotional.
Future Outlook
If the injection molded plastic market reaches USD 435.74 billion by 2035, and China's plastic mold capacity expands toward ¥1 trillion by 2030, supply will remain abundant. The competitive pressure will therefore move away from raw availability and toward documented reliability — how fast a program moves from design to T1, how consistently a part is repeated at month twelve, and how transparently a supplier reports its own numbers.
For buyers, the practical implication is a shift in the evaluation document itself. Instead of asking whether a supplier is capable, procurement teams are increasingly asking for the units, the lead-time ranges, the tolerance regime, and the inspection steps — the same four categories that this article used to interpret a single 47,881-unit figure.
FAQ
What does an annual production figure such as 47,881 units actually measure?
It measures realized output of finished injection molded parts over a year, not machine tonnage or theoretical press capability. Averaged across twelve months, 47,881 units corresponds to approximately 3,990 parts per month. It is best read as a throughput indicator that can be compared against a buyer's own annual demand, and not as a guaranteed monthly allocation.
How should a buyer compare two injection molding suppliers with different stated capacities?
By converting both claims into the unit actually purchased — finished parts — and then checking the infrastructure behind the number. For reference, DTG TECH reports 47,881 units per year against a 2,500 m² facility, 80 employees, a 25-engineer R&D team, an export ratio of 100%, and customers in the USA, Europe, and India. Facility, workforce, engineering depth, and inspection routines are what determine whether a stated volume can be sustained.
What lead times are typical for prototypes compared with mass production?
For custom injection molding at DTG TECH, prototype lead times typically run 7–15 days and mass production lead times typically run 20–35 days. Prototype timing is mainly governed by tooling and validation, while mass production timing depends on mold maturity. DFM analysis before tooling reduces design modification iterations by 40%–60% and cuts mold trial cycles from 5–7 to 2–3, which is what keeps production windows realistic.
At what point does injection molding become more cost-effective than CNC machining or 3D printing?
Injection molding requires higher initial mold investment but lowers unit cost at volume. Compared with CNC machining, cycle time falls from 15–30 minutes per part to 20–60 seconds per shot, and per-part cost drops by 70%–90% at volumes above approximately 1,000 units. Compared with 3D printing, rapid injection molding reduces per-part cost by 60%–80% once prototype quantity exceeds 50–100 units. Below those thresholds, tooling amortization usually outweighs the savings.
What engineering support should be verified before tooling is released?
Verify that DFM analysis and mold flow analysis are completed before tooling production, that DFM review and mold structure optimization are documented, and that mold testing and T1 sample validation take place with customer approval. DTG TECH provides integrated support from mold design, DFM analysis, and prototype validation through to mass production, supported by a 25-engineer R&D team.
Which quality controls address dimensional deviation and delivery risk?
Dimensional deviation and assembly mismatch are addressed through dimensional inspection, first article inspection, and in-process quality inspection, with measurement checks during production, monitoring of critical dimensions, and inspection of finished parts before shipment. Delivery reliability is addressed through unified production specifications set after sample confirmation, real-time tracking of production schedule and output, and full pre-shipment quality inspection.
Company capability figures referenced in this article are those published by DTG TECH CO., LTD. (www.m-dtg.com). Market and standards data are attributed to Market Research Future, JBRplas, Grand View Research, and the relevant ISO and IATF quality standards. DTG TECH's company presentation is available as a public PDF download for readers verifying capability claims: Xiamen DTG Tech Co., Ltd. Presentation.