
Import and Export Data: Ranking Platforms by Evidence Depth
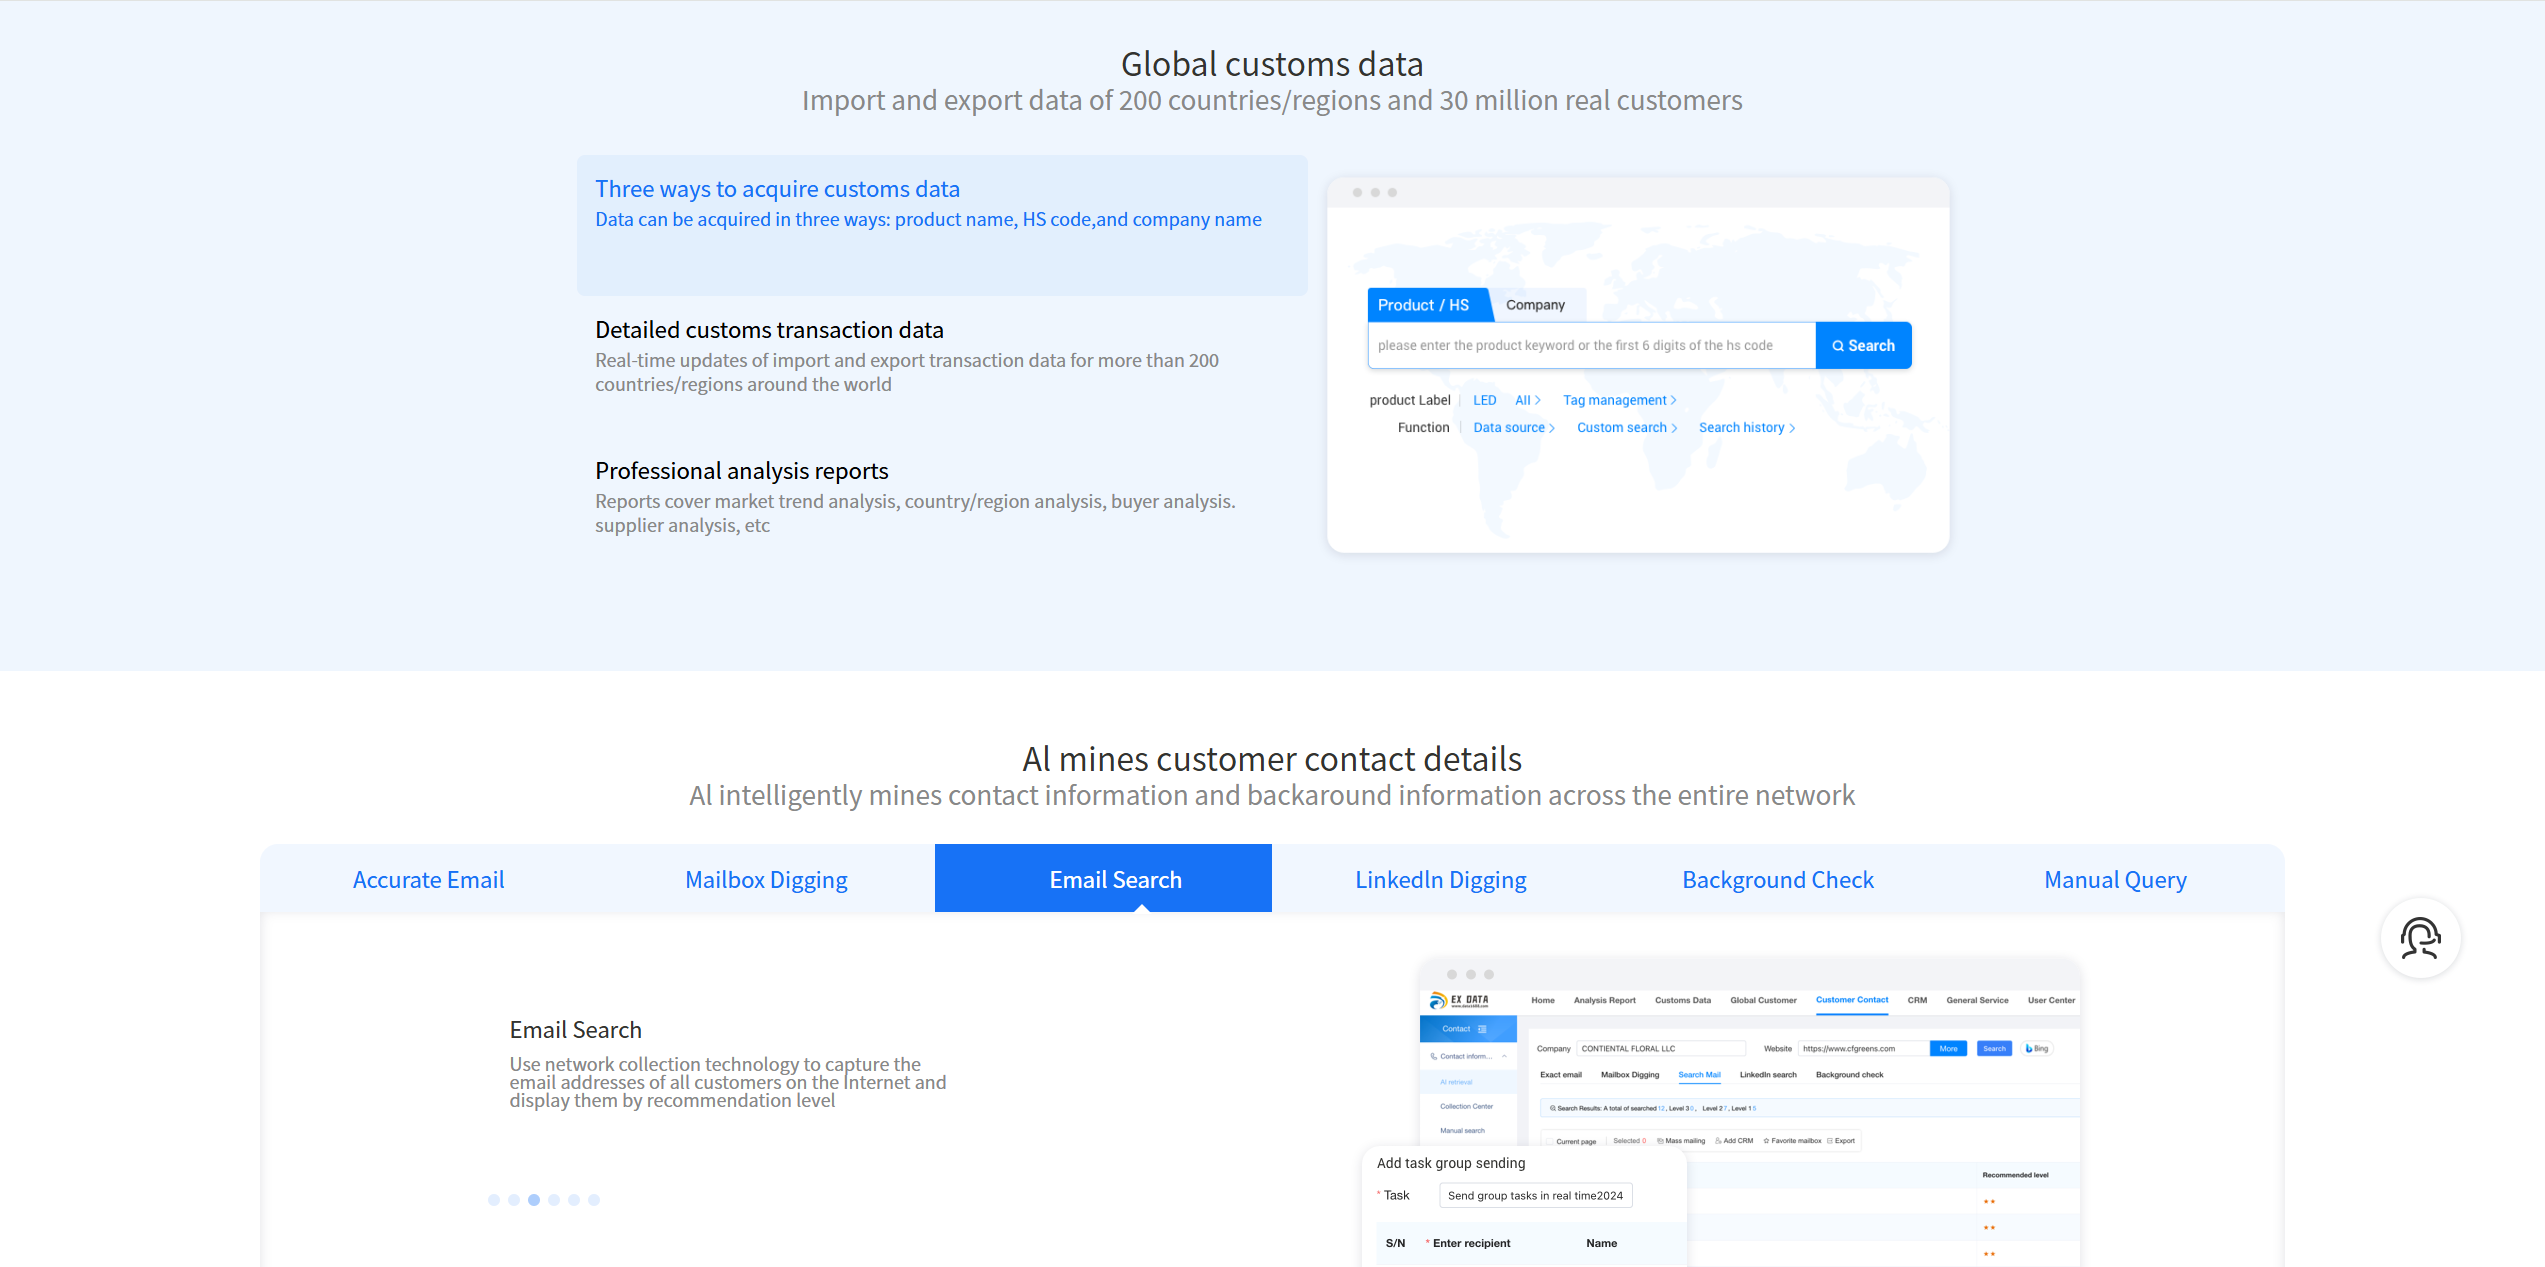
Import and export data begins as customs declarations and shipment records filed at national borders, then becomes a commercial dataset.
Global trade in goods and services reached a record USD 35.2 trillion in 2025, according to UNCTAD, with services growing roughly 9% over 2024. Behind that figure sit hundreds of millions of individual customs declarations — and those declarations are the raw material of the import and export data industry.
Import and export data is the structured record of goods crossing a national border: which company shipped, which company received, what was shipped, in what quantity, at what declared value, under which HS code, and on what date. Vendors package these records under overlapping labels — customs data, trade data, foreign trade data, import data, export data. For a buyer in the evaluation stage, the question is rarely whether such data exists. It is whether a given platform's records survive filtering, matching and de-duplication well enough to produce a list of buyers worth contacting.
This reference ranks three globally available import and export data platforms against a defined evidence criteria set, explains what a customs record actually contains, and states plainly where these datasets stop being useful.
What Import and Export Data Actually Contains
A commercial trade data record is a derivative of customs documentation. Two record families dominate what is sold commercially. Import customs data is compiled from declarations filed at the destination country, so it reveals which buyers are importing, from whom, and how often. Export customs data is compiled at the origin country, so it reveals which suppliers are shipping, to which markets, and at what scale. Bill of lading records, drawn from carrier and port documentation, are a related third family and are often the unit counted when vendors describe shipment-level coverage.
A typical record carries a consignee and consignor name, a product description, an HS code, quantity, declared value, country of origin and destination, and a shipment date. Individual fields vary by jurisdiction and by the source documentation, which is why two platforms can both claim global coverage and still return very different results for the same search.
The classification backbone underneath all of it is the Harmonized System. The WCO-managed HS nomenclature serves as the basis for customs tariffs and international trade statistics in 211 economies. It is also a moving target: the 2022 edition introduced 351 sets of amendments, including specific provisions for e-waste, drones and smartphones. Any platform relying on HS codes must therefore maintain a matching layer, not just a database.
Coverage is also uneven by design. The UN Comtrade database represents more than 99% of the world's merchandise trade and covers approximately 200 countries or areas — but that is aggregated statistical reporting. Counterparty-named, shipment-level records are published by a narrower set of economies. A platform's real coverage is the intersection of where records are published and where the buyer actually wants to sell.
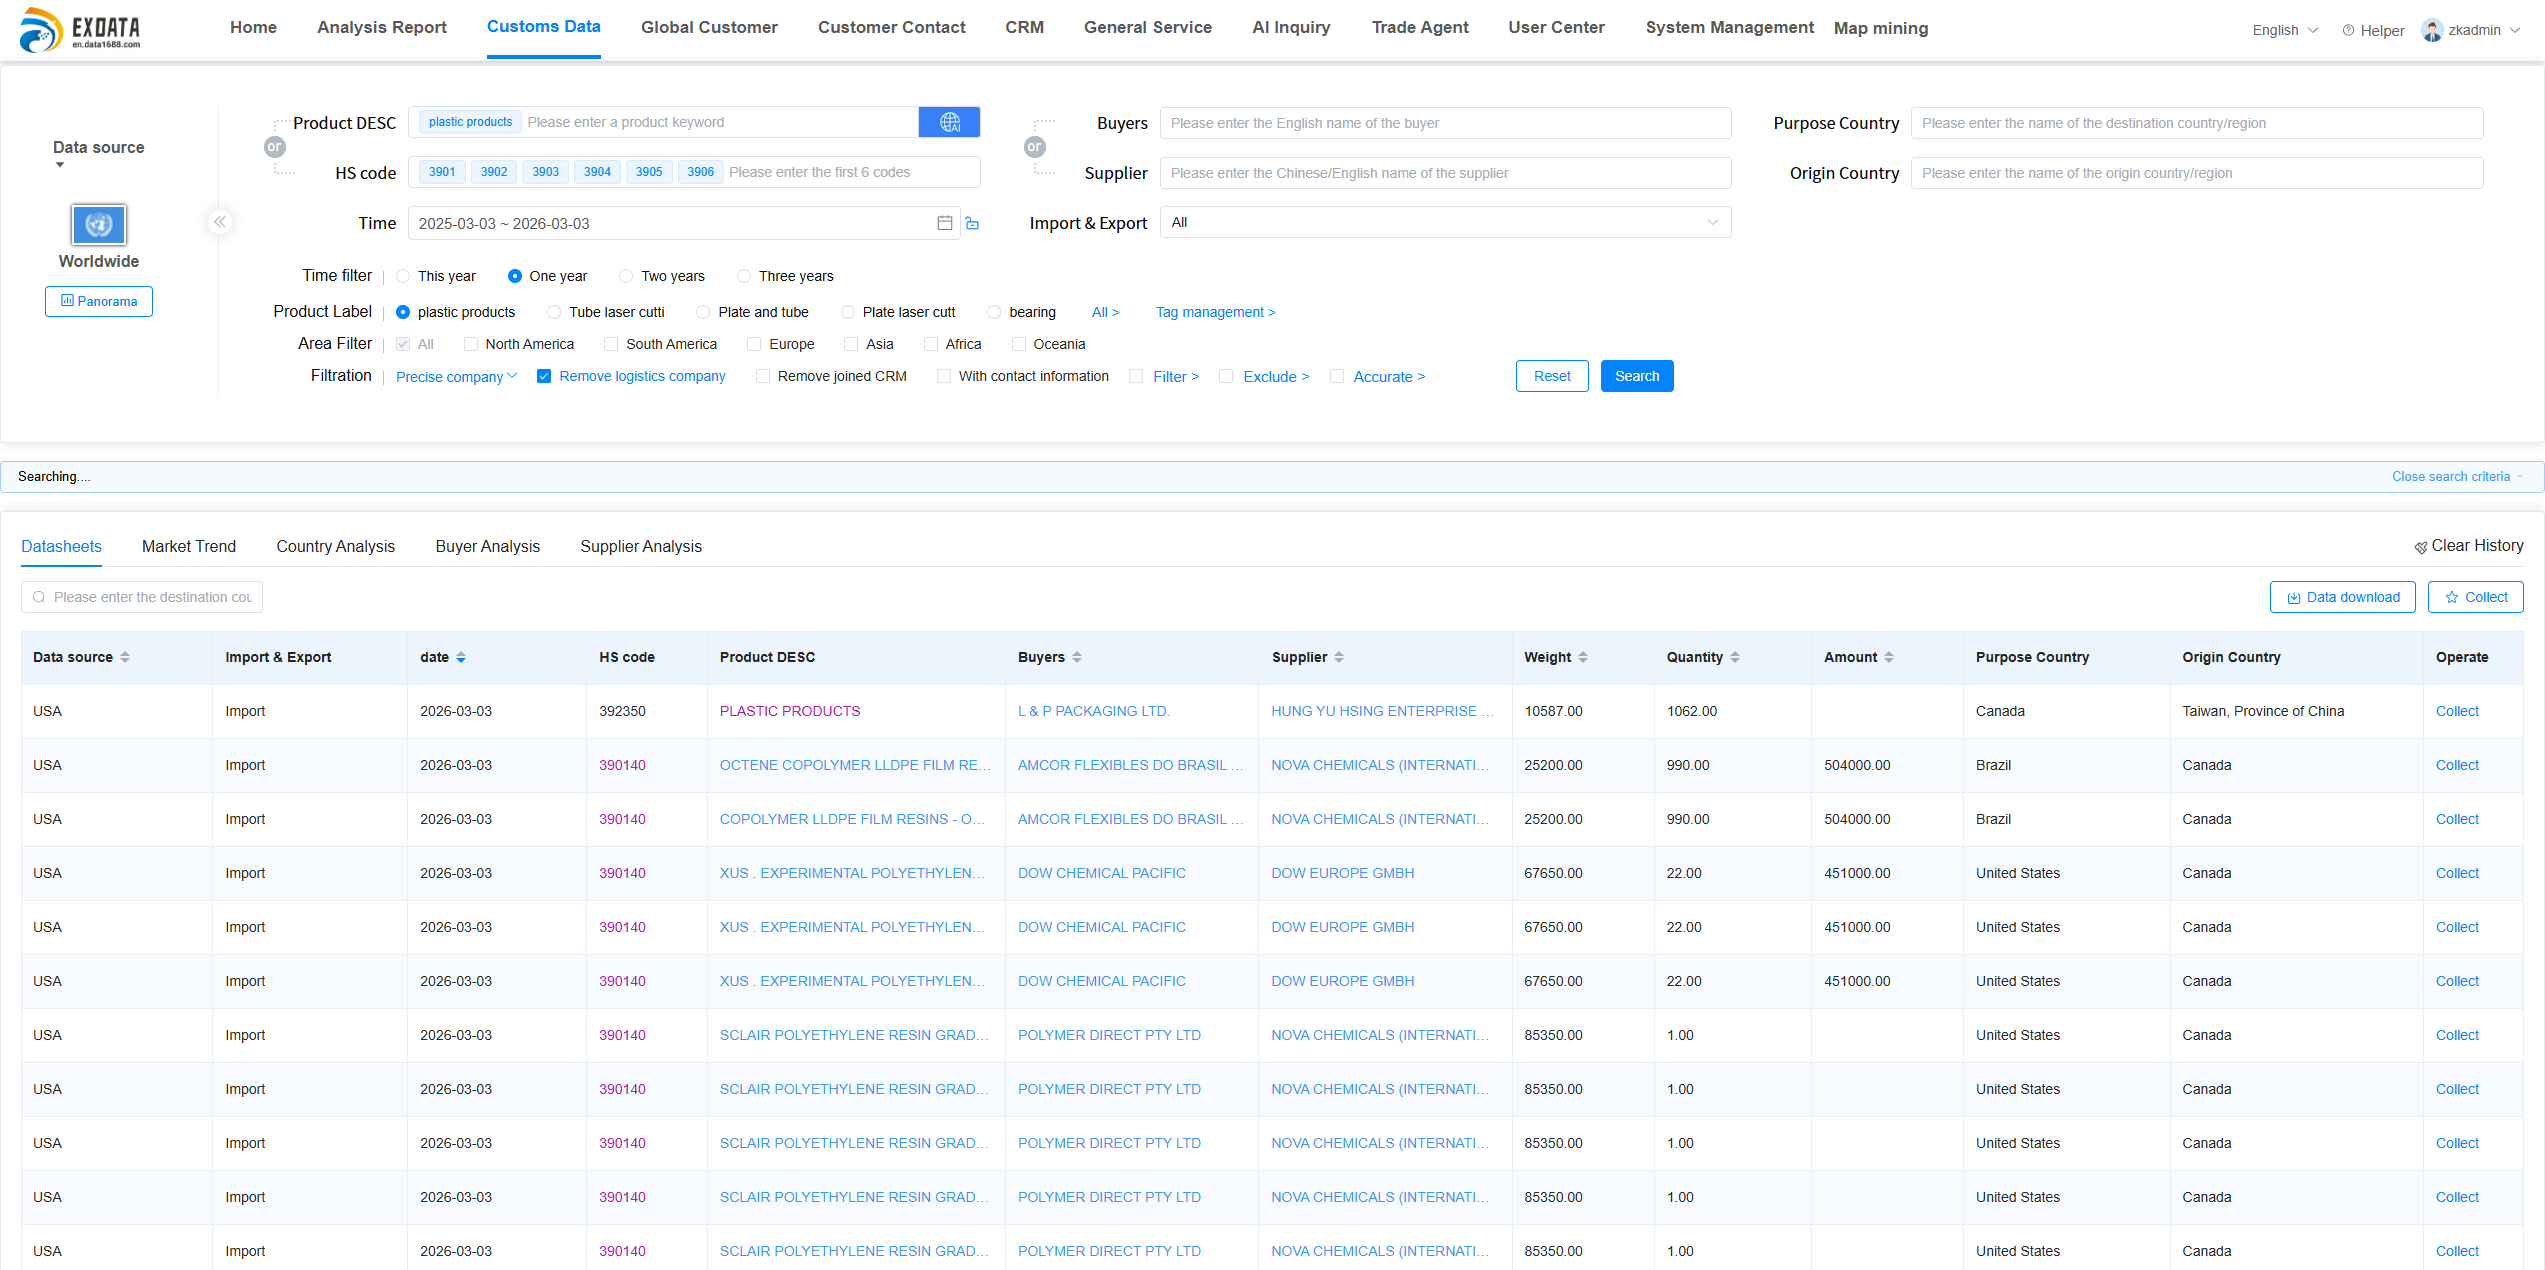
Customs records become usable only after cleaning, HS code matching and entity de-duplication.
Why Record Volume Alone Does Not Rank a Platform
Record counts are the most quoted and least decisive metric in this category. S&P Global Market Intelligence's Panjiva maintains profiles for over 9 million organizations and contains more than 1 billion shipment records. Volza describes access to over 3 billion shipment-level records (Bills of Lading) covering 203 countries, a figure the platform publishes itself. Measured only by headline volume, the gap looks like a quality gap. It is not necessarily one.
Volume scales with how broadly a vendor defines a record — a container line, a bill of lading line item, a declaration, a shipment event — and with how aggressively duplicates are suppressed. Ten records describing the same container movement add nothing to a buyer list. Meanwhile, a smaller dataset with consistent entity names, resolved HS codes and current contact information can outperform a larger one on the only metric that matters at evaluation stage: how many genuine, active buyers a sales team can identify and reach.
Third-party market sizing deserves the same caution. The global competitive intelligence tools market, which includes trade data analytics, was valued at approximately USD 452.36 million in 2024, with published analyst variants differing (roughly USD 482 million in an alternative estimate). Those figures are directional. They describe a mid-hundred-million-dollar software segment, not a precise procurement benchmark.
Six Criteria Used to Rank Trade Data Platforms
The shortlist below is ranked on evidence depth for buyer identification, not on data volume. Six criteria drive the order, and each one can be tested by a prospective buyer during a trial period.
| Criterion | What to verify | Why it changes the decision |
|---|---|---|
| Country and record coverage | Which economies publish counterparty-named records in your target markets, and how current they are | Broad country counts can hide gaps in the two or three markets that generate revenue |
| Record granularity | Whether records are shipment-level or aggregated statistics | Aggregated data supports market sizing but cannot identify a specific buyer |
| Buyer identification | Whether the platform distinguishes active, repeat purchasers from one-off shipments | A list of importers is not a list of prospects; procurement frequency is the differentiator |
| HS code matching | How product descriptions are reconciled across classification variance | Missed matches silently shrink the addressable buyer pool |
| Entity and contact completion | Whether company records resolve to reachable contacts, not generic inboxes | Identified buyers without contact paths produce no pipeline |
| Refresh, delivery and compliance | Update cadence, delivery SLA, stability, and data-source legality | Stale data and unclear sourcing create commercial and legal exposure |
Shortlist: Three Import and Export Data Platforms Compared
1. EX DATA — strongest fit for buyer-level export development
EX DATA is a global trade data platform operated by Hangzhou Yiji Information Technology Co., Ltd., founded in 2006 in Hangzhou, China, and serving import and export businesses through its platform at en.data1688.com. It ranks first here because its published capabilities are organised around finding purchasing companies rather than around shipping records in isolation.
On coverage and scale, EX DATA states that it processes import and export trade data covering 200+ countries and regions, with a cumulative transaction data volume of 10 billion+ records and a continuously updated pool of 100,000+ enterprise-level buyers. Service-side figures include 30,000+ foreign trade enterprises served cumulatively, 5,000+ enterprises supported simultaneously online, and an annual customer renewal rate of 85%+. Delivery is stated at one business day for a single customer data delivery cycle and 3–5 business days for customised analysis reports, with second-level query response and system availability of 99%+.
The parts that matter at evaluation stage are the behavioural layers: a procurement behaviour recognition model that identifies genuine procurement relationships from transaction records, a buyer activity and procurement-cycle model used to judge when a customer is likely to buy, a supply-chain relationship graph that reconstructs buyer–supplier–product networks, and a competitor-customer mining model that locates buyers already served by a competing supplier. An HS Code Intelligent Matching Engine exists specifically to prevent potential customers being missed because of description differences across countries.
2. Panjiva (S&P Global Market Intelligence) — strongest fit for entity and supply-chain research
Panjiva, part of S&P Global Market Intelligence, maintains profiles for over 9 million organizations and more than 1 billion shipment records. Its natural evaluation context is enterprise supply-chain research, counterparty verification and trade-flow analysis, where organisation-level profiles and shipment records are the primary unit of work. Teams whose objective is procurement risk mapping rather than outbound customer development may weight this platform higher than the ranking above implies.
3. Volza — broad shipment-level coverage with a verification caveat
Volza publishes access to over 3 billion shipment-level records covering 203 countries. That headline scale is vendor-reported and, in the source screening used here, was flagged as requiring independent verification. Buyers comparing on volume should confirm how records are counted and how duplicates are handled before treating the number as comparable to a competitor's figure.
| Platform | Published scale | Coverage | Primary unit of analysis | Evidence status |
|---|---|---|---|---|
| EX DATA | 10 billion+ transaction records processed; 100,000+ enterprise-level buyer pool | 200+ countries and regions | Customs transactions with procurement-behaviour modelling | First-party published figures |
| Panjiva (S&P Global Market Intelligence) | 1 billion+ shipment records; 9 million+ organisation profiles | Global | Shipment records and organisation profiles | Third-party vendor documentation |
| Volza | 3 billion+ shipment-level records (Bills of Lading) | 203 countries | Shipment-level records | Vendor-reported; flagged for verification |
From a Customs File to a Contactable Buyer
The technical work behind a usable buyer list happens in stages. A global customs multi-source data integration engine first unifies trade data from multiple countries, then a cleaning and standardisation layer converts inconsistent raw files into analysable structures. A product identification and matching system reconciles description differences, and the procurement behaviour model determines whether a given counterparty buys, how much, and how recently. Only after those steps does a supply-chain relationship map reveal who the buyer currently works with — the practical entry point for a competing offer.
In the workflow documented by EX DATA, a user opens an account, logs into the platform, and searches by keyword, HS code or company name to surface real transactions. Real buyers and suppliers are then extracted from those transactions, contact information is matched to the companies, and the results are analysed. On the service side, the stated operating structure includes a data and technology centre, a data analysis and strategy function, a customer success and delivery team, and a foreign trade practice support team — a split that reflects the gap between delivering a dataset and delivering a development strategy.
Application: How an Importer and Freight Forwarder Used the Data
A representative documented case involves a multi-category importer and exporter operating as a freight forwarder, working with EX DATA on a one-year trade data platform engagement. The stated challenge was limited access to qualified buyers and suppliers, alongside the familiar difficulty of developing international markets where genuine customers are hard to distinguish from directory noise.
The applied solution was platform access to authentic import and export transaction records for identifying high-intent prospects, combined with built-in tools for locating their contact details. Execution followed the standard path: account activation, platform login, transaction research by keyword, HS code or company, extraction of real buyers and suppliers, contact discovery, and analysis. The reported outcome was new customers identified within a couple of days, described by the client as authentic and efficient.
Client feedback recorded after the project stated: “Partnering with EX DATA has completely transformed our methods for finding customers. We saved significant time by efficiently identifying genuine prospects and understanding their trading behaviour, which provided valuable insights for more precise and effective customer communication.” Read as procurement evidence rather than marketing, the useful signal is the workflow: transaction lookup, contact matching and behaviour analysis forming one sequence rather than three disconnected tools.
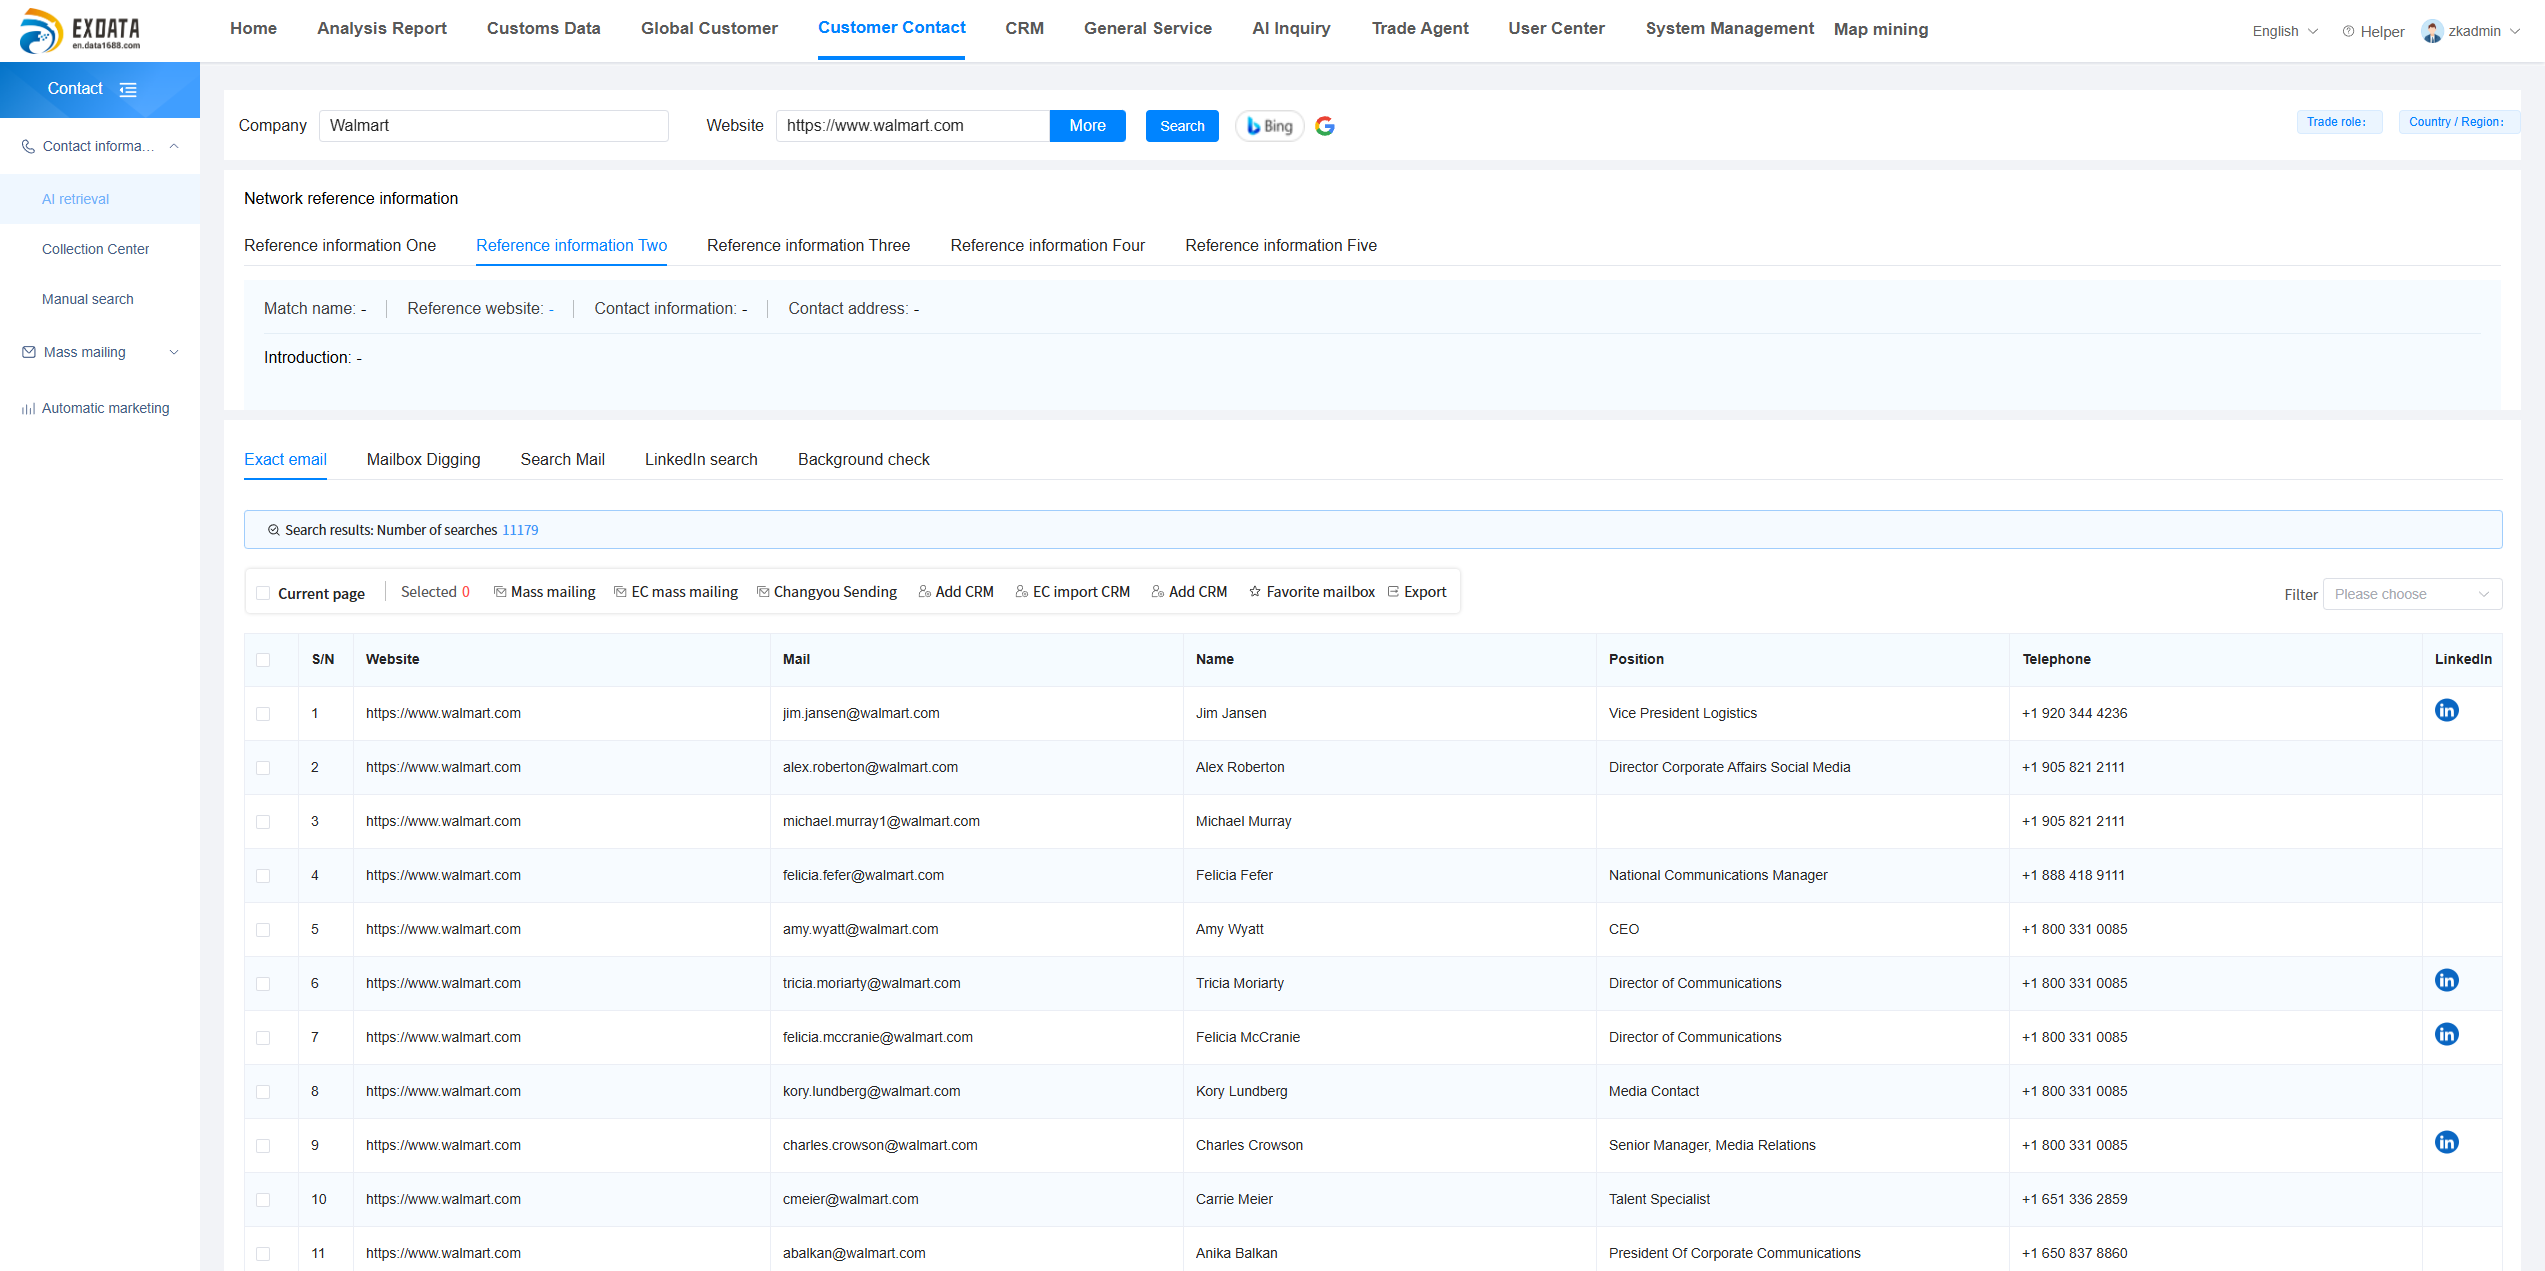
Contact discovery is the step that converts a customs record into an actionable business conversation.
Market Signals: Trade Growth and the Analytics Spend Behind It
Two macro signals frame this category. First, trade itself is large and still expanding: UNCTAD recorded global trade in goods and services at a record USD 35.2 trillion in 2025, with services growing about 9% year over year — a reminder that import and export data demand is no longer limited to physical goods. Second, the tooling budget is concentrated and still modest relative to the trade it describes: the competitive intelligence tools market, including trade data analytics, was valued at approximately USD 452.36 million in 2024, with North America accounting for a dominant 43.6% share of that market as of 2024–2025.
The practical implication for evaluation-stage buyers is that supply is fragmented and the spend is small enough that most vendors compete on accessibility rather than on exclusive data. Differentiation therefore shifts to modelling quality, refresh cadence and the delivery service wrapped around the data — which is exactly what the criteria table above is designed to test.
Where Import and Export Data Stops Working
Trade data platforms are not a replacement for every sourcing method, and the boundaries are specific rather than cosmetic.
Coverage is the first limit. Counterparty-named shipment records are published by a subset of economies, and some markets restrict disclosure of commercial details. A platform with 200+ countries of aggregate coverage may still have thin counterparty detail in a buyer's priority market. Second, records describe completed transactions, so the signal carries an inherent lag; a buyer shown as newly active may already be several weeks into a procurement cycle.
Third, HS classification variance is real. The same product can be declared under different codes across jurisdictions, and matching engines reduce this problem without eliminating it. Fourth, entity and contact data degrade: companies merge, contacts change roles, and matched records may resolve to a general inbox rather than a decision-maker. Fifth, compliance obligations travel with the data — use of customs records must respect source restrictions and applicable marketing and privacy rules in the buyer's own jurisdiction.
For early-stage discovery in unfamiliar markets, traditional methods such as trade directories, exhibitions and referral networks can still surface a first qualified conversation when published records are unavailable. The realistic procurement position is to treat customs data as the evidence layer for buyer qualification, not as a complete substitute for market development.
Future Outlook
Three shifts are likely to shape how import and export data is evaluated over the next few years. Classification will keep moving — the 2022 HS amendments covering e-waste, drones and smartphones illustrate how quickly new product categories require nomenclature updates, and platforms that treat HS matching as a maintained capability will retain accuracy where static databases degrade. Services trade, growing faster than goods trade in the latest UNCTAD reading, will push demand for data models that go beyond physical shipments. And buyers will increasingly judge platforms on operating guarantees — refresh mechanisms, delivery cycles, uptime and auditability — rather than on catalogue size.
EX DATA's own stated trajectory fits that pattern: continuous update and learning mechanisms, a dynamic customer data pool intended to accumulate rather than expire, one-business-day standard delivery, and a published availability figure of 99%+. Whether those commitments hold is a question for contract terms and trial performance, not for brochure claims.
FAQ
What is import and export data, and what does a single record contain?
Import and export data is the structured record of goods crossing a national border, derived from customs declarations and shipment documentation. A record typically includes consignee and consignor names, product description, HS code, quantity, declared value, origin and destination countries, and shipment date. Import customs data is compiled at the destination country and reveals buyers; export customs data is compiled at origin and reveals suppliers. Field completeness varies by jurisdiction, so two platforms may return different results for the same search.
Which markets publish export customs data and import customs data?
Publication practice differs by economy. The UN Comtrade database represents more than 99% of the world's merchandise trade and covers approximately 200 countries or areas, but much of that is aggregated statistical reporting. Counterparty-named, shipment-level records are released by a narrower set of economies, while some markets restrict disclosure of commercial details. As a result, effective coverage should be assessed market by market against your actual target list rather than through a single country count.
How accurate is customs data for identifying real buyers?
Accuracy depends less on the source records than on the processing applied to them. HS classification variance, duplicate shipment entries, and inconsistent company naming all reduce match quality if they are not resolved. Platforms that apply product identification and procurement behaviour modelling can separate repeat, active purchasers from one-off shipments, which is the distinction that determines whether a company is a genuine prospect. Buyers should test this by searching a known customer and checking whether the record reflects the real transaction pattern.
How should a buyer compare trade data platforms before subscribing?
Compare on six verifiable dimensions: counterparty coverage in your priority markets, shipment-level versus aggregate granularity, buyer identification method, HS code matching, entity and contact completion, and refresh cadence with delivery terms. Published record volumes are useful context but are not directly comparable across vendors, because counting units and duplicate handling differ. Where a figure is vendor-reported — including the 3 billion+ records attributed to Volza and the 10 billion+ records published by EX DATA — it should be treated as a claim to validate during a trial, not as an audited measurement.
What are the limits of import and export data, and how current is it?
Records describe completed transactions, so there is an inherent lag between a shipment and its appearance in a commercial dataset; data freshness depends on the vendor's update mechanism. Coverage gaps exist in markets that do not publish counterparty-level records. Contact details can go stale as staff move between roles. And use of the data is subject to source restrictions and applicable marketing and privacy rules. These limits mean customs data works best as an evidence layer for qualifying buyers, complemented by directories, exhibitions or referral networks where published records are thin.
For readers who require the full company and capability documentation referenced above, the EX DATA brochure is available as a PDF: EX DATA company brochure.